Widgets
Widgets refer to customizable and interactive elements that display specific data and information on dashboards and interfaces. These dynamic components enhance data visualization, making it easier for users to comprehend complex information and derive actionable insights.
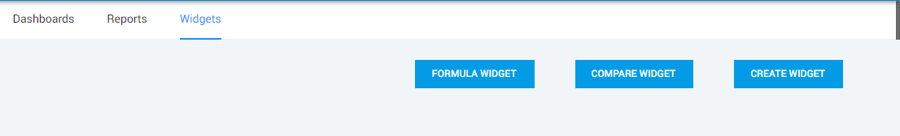
There are three types of widgets available:
Formula Widget
Compare Widget
Create Widget
Formula Widget
The Formula Widget in Hubbler is a dynamic component that allows users to perform calculations and create custom expressions based on data from various sources. This widget empowers users to generate meaningful insights by applying mathematical functions, aggregations, and conditional logic to their data within a dashboard.
Steps to create a Formula Widget:
Click the Formula Widget button located in the top-right corner.
Draft the expression by starting with "@" symbol. Select the relevant data field and apply the desired formula.
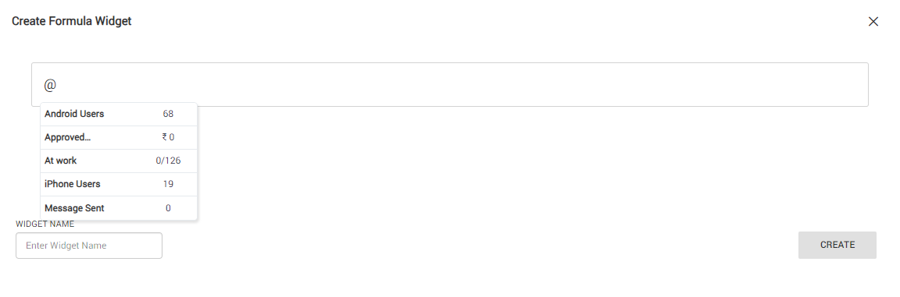

After writing the desired formula, define a suitable name for the widget, reflecting the data it presents.
Click the "Create" button to generate the widget with the specified conditions.
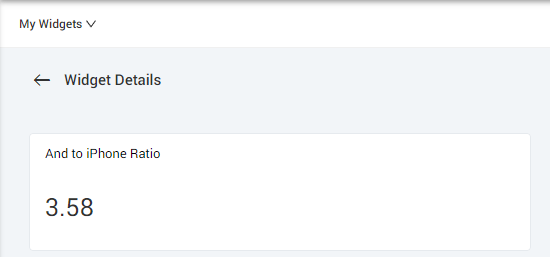
The widget will be displayed with the required data.
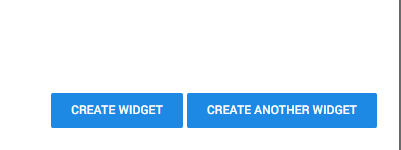
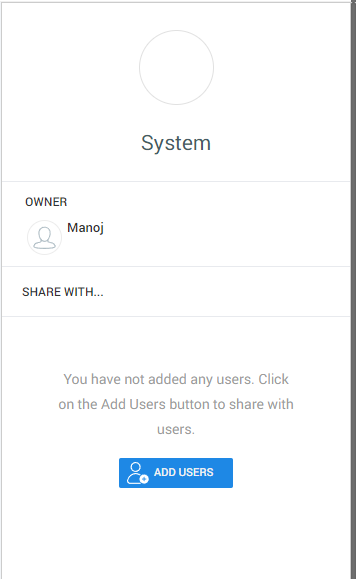
You can add the users to the newly created widgets using the ADD USERS button on the right pane.
Compare Widget
The Compare Widget in Hubbler is a dynamic component that facilitates the comparison of data between different entities, time periods, or categories. This widget empowers users to visualize trends, variances, and relationships, enabling informed decision-making by highlighting insights through side-by-side comparisons.
Steps to create a Formula Widget:
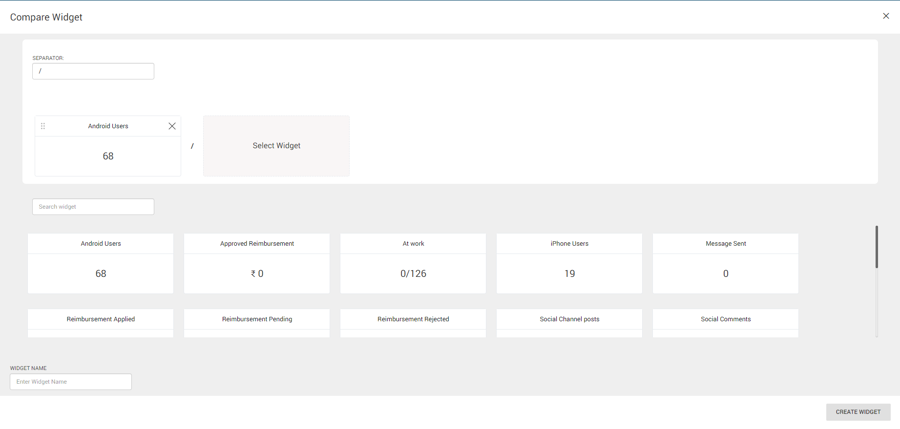
Click the Formula Widget button located in the top-right corner.

This action will display a list of available widgets for comparison purposes.

Click on the widget tab to choose the first widget for comparison.
Continue selecting widgets that you wish to compare. Remember, a maximum of three widgets can be selected at a time for comparison.
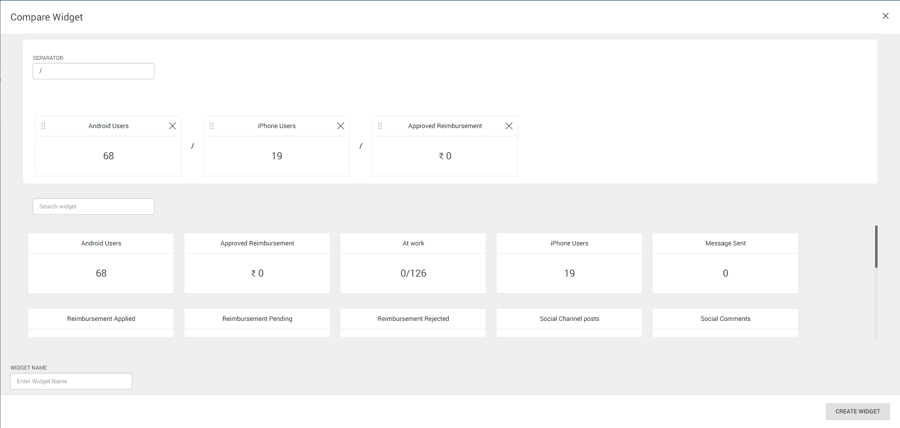
Define the name of the widget by entering it in the designated area located at the left bottom corner.

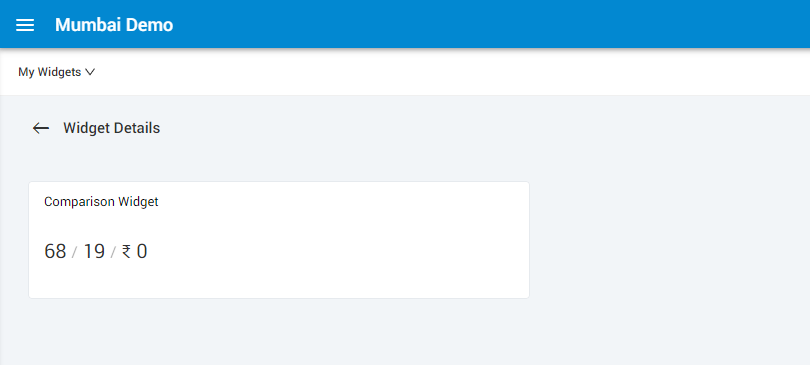
Click on the "Create Widget" button to confirm your selections and generate the desired widget for comparison.
You can add the users to the newly created widgets using the ADD USERS button on the right pane.
Create Widget
Create widget is used to create a normal widget connected to an app.
Steps to create a Create Widget:
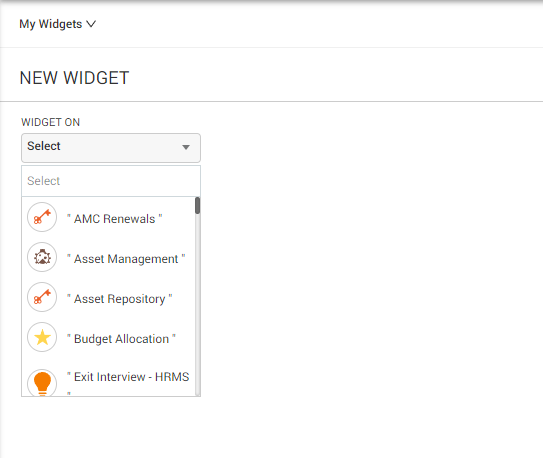
Start by selecting the desired app for widget creation. This can be done by picking from the dropdown menu labeled "Widget On."
After app selection, choose the appropriate widget type and set the Frequency and Data Field based on your needs.
Widget Type - This option is used to select the format in which the data needs to be presented.

Critical number
Table
Bar Graph
Line Graph
Donut Chart
Scatter Map
Heat Map
Frequency - This option is used to set the frequency of the reports.

Date Field - This option is used to select the date parameter as created, modified, or closed.

Created Date & Time
Modified Date & Time
Closed Date & Time
In the left pane, you will find a list of data fields containing the information to be measured in reports.
To use a specific data field, simply drag and drop it into the designated area on the right-hand side.

Once the data field is placed, the widget will display the value associated with the selected data.
Unit Details - This option is used to define the unit of the values displayed in the reports with an option to enter a custom label.

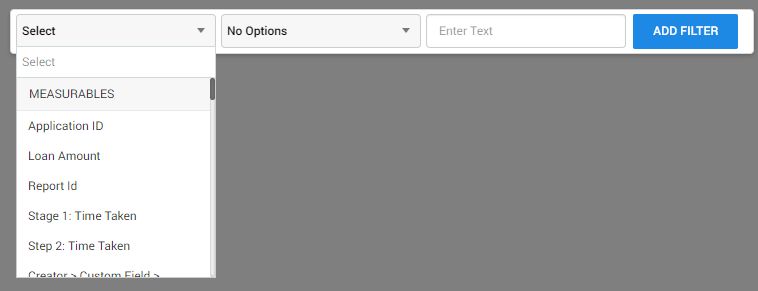
Filter By - For more tailored data, you can refine the content by adding filters to the bulk data. Achieve this by clicking the "Add" button located under the "Filter By" option.

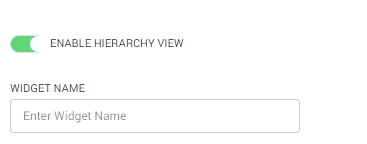
Define the name of the widget by entering it in the designated area located at the left bottom corner.
Once all the required options are selected, click on Create Widget on the bottom right corner of the canvas to create the widget.